 地图组件
地图组件
# 地图组件
map 组件用于展示地图以及在地图上标记位置。该组件在多个平台支持,包括 App、H5、小程序等。与定位 API 不同,map 组件主要用于显示地图和标记,而定位 API 仅用于获取位置信息。
# 1. 什么是 map 组件?
map 组件可以展示地理信息地图,支持在地图上添加标记点、路线、控制器等元素,常用于应用的地图定位、路线规划、POI 查询等场景。
使用场景
- 位置展示:在地图上显示用户的当前位置信息。
- 路线规划:在地图上显示从起点到终点的路线。
- 标记点:在地图上标注特定的位置信息,展示 POI(兴趣点)。
- 室内导航:通过室内地图展示建筑物内的导航路径。
# 2. map 组件的常用属性
map 组件包含了丰富的属性,用于配置地图的展示样式、缩放级别、标记点、路线等。以下是一些常用属性的说明与使用示例。
| 属性名 | 类型 | 默认值 | 说明 |
|---|---|---|---|
longitude | Number | 无 | 中心经度 |
latitude | Number | 无 | 中心纬度 |
scale | Number | 16 | 缩放级别,取值范围为 3-20 |
markers | Array | 无 | 标记点数组,用于在地图上显示标记 |
polyline | Array | 无 | 路线数组 |
controls | Array | 无 | 控件数组,显示在地图上的操作控件 |
enable-3D | Boolean | false | 是否显示 3D 楼块 |
enable-zoom | Boolean | true | 是否支持地图缩放 |
enable-scroll | Boolean | true | 是否支持地图拖动 |
enable-rotate | Boolean | false | 是否支持地图旋转 |
show-location | Boolean | false | 是否显示当前定位点 |
# 2.1 中心经纬度 longitude 和 latitude
- 说明:设置地图的中心点经纬度。
- 类型:
Number - 默认值:无
<template>
  <view>
    <!-- 设置地图中心点 -->
    <map :longitude="116.39742" :latitude="39.909" style="width: 100%; height: 300px;"></map>
  </view>
</template>

<script setup>
const longitude = 116.39742;
const latitude = 39.909;
</script>
1
2
3
4
5
6
7
8
9
10
11
2
3
4
5
6
7
8
9
10
11
# 2.2 标记点 markers
- 说明:在地图上展示标记点。
- 类型:
Array - 默认值:无
<template>
  <view>
    <!-- 设置地图的标记点 -->
    <map :longitude="116.39742" :latitude="39.909" :markers="markers" style="width: 100%; height: 300px;"></map>
  </view>
</template>

<script setup>
const markers = [
  {
    id: 0,
    latitude: 39.909,
    longitude: 116.39742,
    iconPath: '/static/location.png',
    width: 50,
    height: 50
  }
];
</script>
1
2
3
4
5
6
7
8
9
10
11
12
13
14
15
16
17
18
19
2
3
4
5
6
7
8
9
10
11
12
13
14
15
16
17
18
19
# 2.3 路线 polyline
- 说明:在地图上显示一条路线。
- 类型:
Array - 默认值:无
<template>
  <view>
    <!-- 显示地图路线 -->
    <map :longitude="116.39742" :latitude="39.909" :polyline="polyline" style="width: 100%; height: 300px;"></map>
  </view>
</template>

<script setup>
const polyline = [
  {
    points: [
      { longitude: 116.39742, latitude: 39.909 },
      { longitude: 116.40542, latitude: 39.920 }
    ],
    color: '#FF0000DD',
    width: 5
  }
];
</script>
1
2
3
4
5
6
7
8
9
10
11
12
13
14
15
16
17
18
19
2
3
4
5
6
7
8
9
10
11
12
13
14
15
16
17
18
19
# 2.4 地图缩放 scale
- 说明:设置地图的缩放级别,取值范围为 3-20,数字越大地图显示得越详细。
- 类型:
Number - 默认值:16
<template>
  <view>
    <!-- 设置地图缩放级别 -->
    <map :longitude="116.39742" :latitude="39.909" :scale="18" style="width: 100%; height: 300px;"></map>
  </view>
</template>
1
2
3
4
5
6
2
3
4
5
6
# 2.5 控件 controls
- 说明:在地图上添加自定义控件,控件可以用于操作地图或触发事件。
- 类型:
Array - 默认值:无
<template>
  <view>
    <!-- 设置地图控件 -->
    <map :longitude="116.39742" :latitude="39.909" :controls="controls" style="width: 100%; height: 300px;"></map>
  </view>
</template>

<script setup>
const controls = [
  {
    id: 1,
    iconPath: '/static/control.png',
    position: {
      left: 10,
      top: 10,
      width: 50,
      height: 50
    },
    clickable: true
  }
];
</script>
1
2
3
4
5
6
7
8
9
10
11
12
13
14
15
16
17
18
19
20
21
22
2
3
4
5
6
7
8
9
10
11
12
13
14
15
16
17
18
19
20
21
22
# 2.6 事件监听 @markertap, @regionchange, @controltap
- 说明:监听地图中的事件,如点击标记点、区域变化、点击控件等。
- 类型:
EventHandle
<template>
  <view>
    <!-- 监听地图事件 -->
    <map :longitude="116.39742" :latitude="39.909" :markers="markers" @markertap="onMarkerTap" style="width: 100%; height: 300px;"></map>
  </view>
</template>

<script setup>
const markers = [
  {
    id: 0,
    latitude: 39.909,
    longitude: 116.39742,
    iconPath: '/static/location.png',
    width: 50,
    height: 50
  }
];

// 监听标记点点击事件
const onMarkerTap = (e) => {
  console.log('点击标记点', e.markerId);
};
</script>
1
2
3
4
5
6
7
8
9
10
11
12
13
14
15
16
17
18
19
20
21
22
23
24
2
3
4
5
6
7
8
9
10
11
12
13
14
15
16
17
18
19
20
21
22
23
24
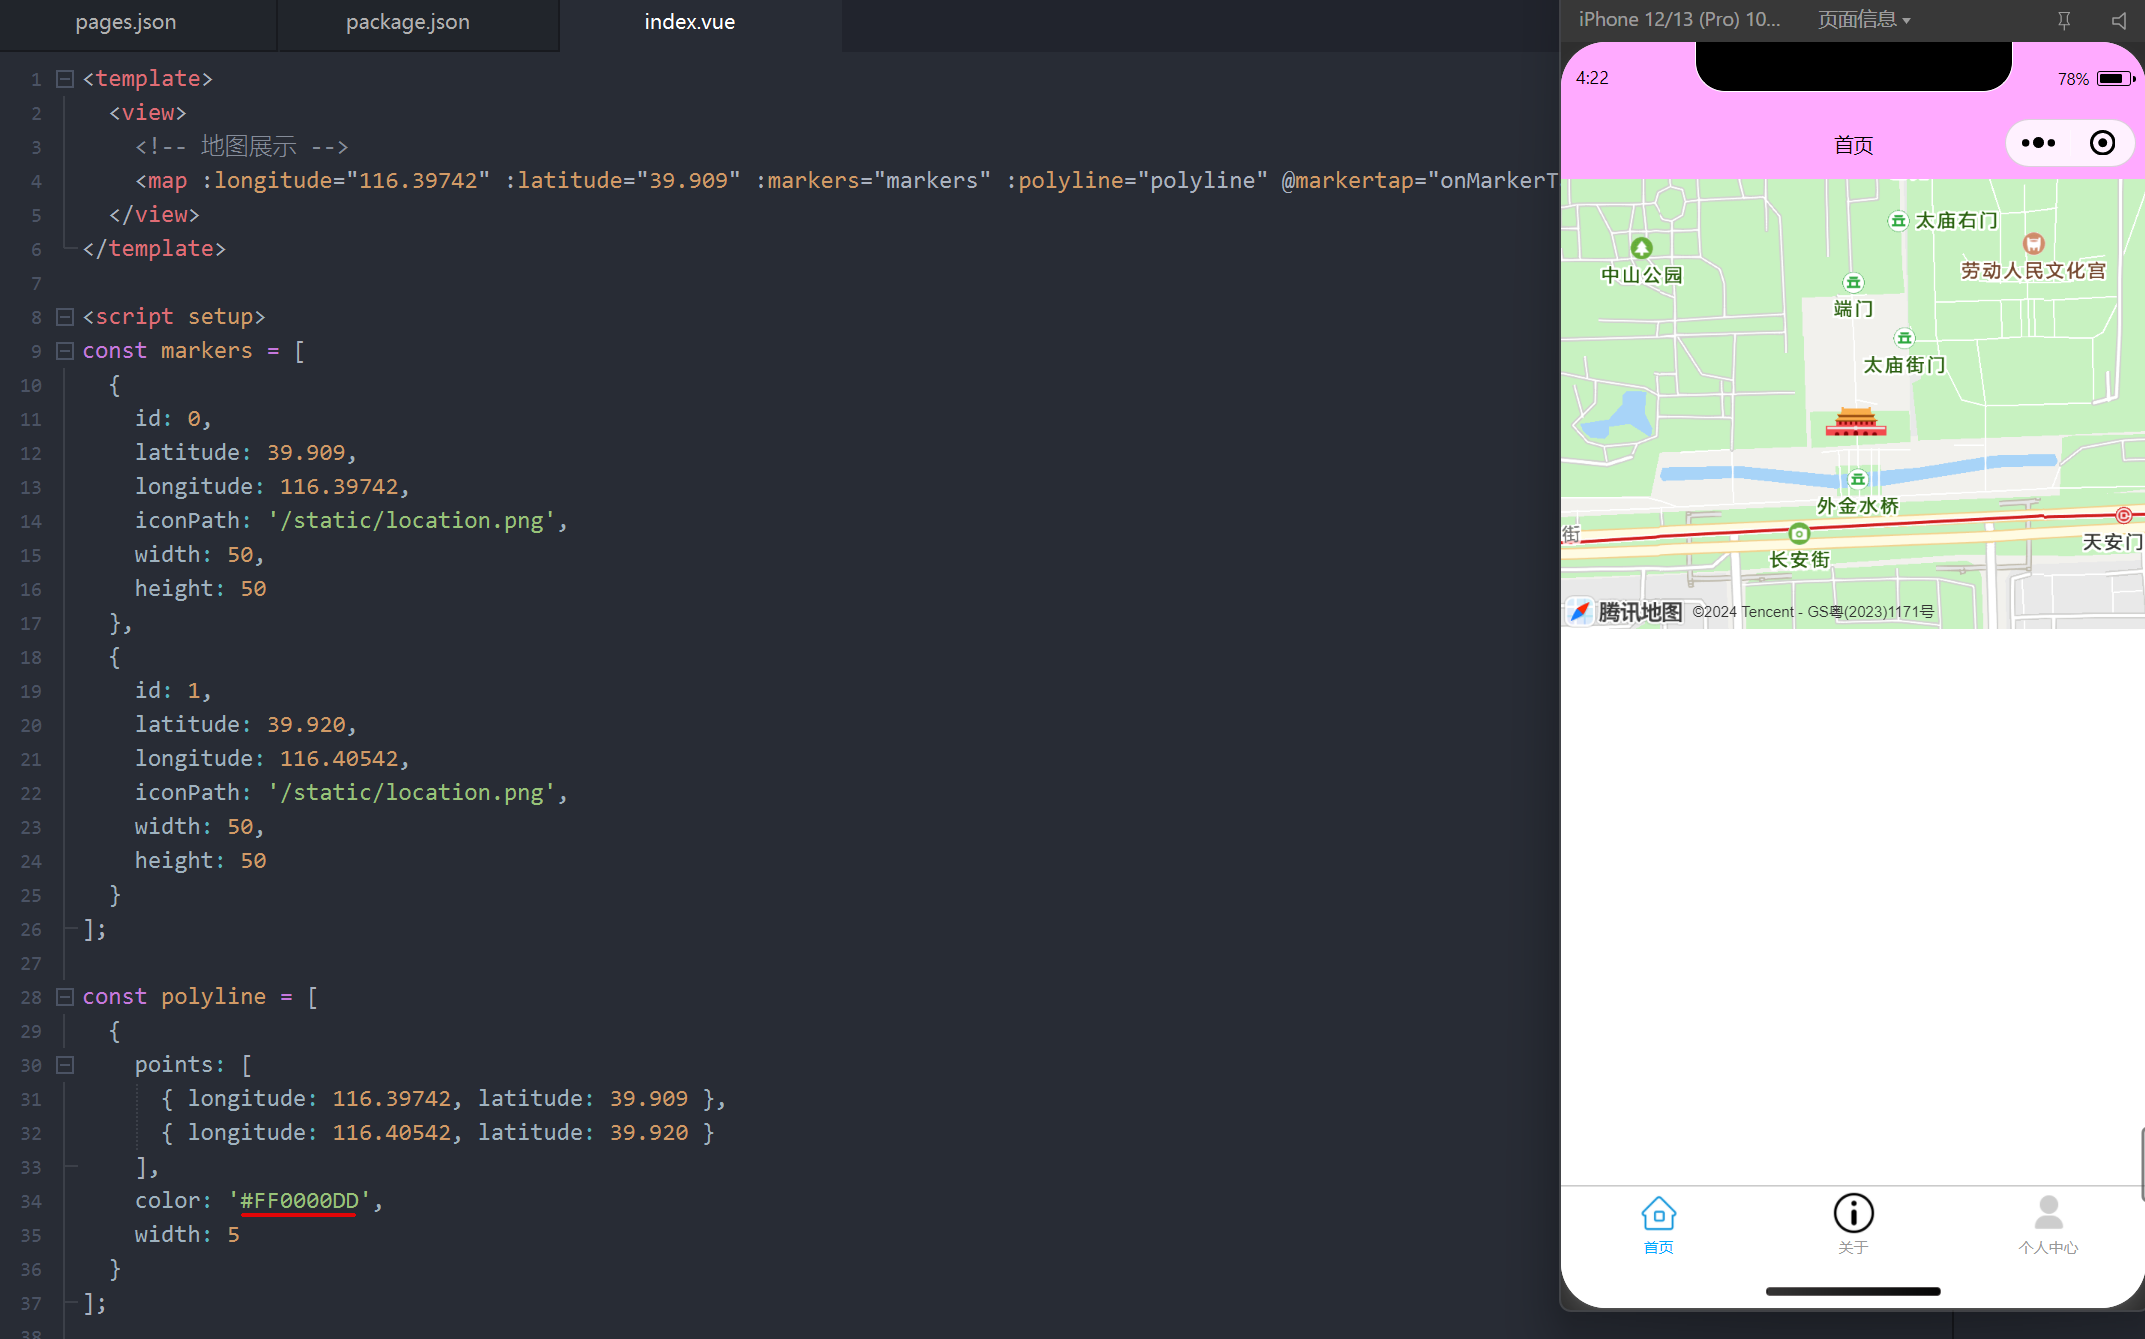
# 3. 展示地图并添加标记与路线
以下案例展示了如何在地图上设置多个标记点,绘制一条路线,并监听标记点的点击事件。
<template>
  <view>
    <!-- 地图展示 -->
    <map :longitude="116.39742" :latitude="39.909" :markers="markers" :polyline="polyline" @markertap="onMarkerTap" style="width: 100%; height: 300px;"></map>
  </view>
</template>

<script setup>
const markers = [
  {
    id: 0,
    latitude: 39.909,
    longitude: 116.39742,
    iconPath: '/static/location.png',
    width: 50,
    height: 50
  },
  {
    id: 1,
    latitude: 39.920,
    longitude: 116.40542,
    iconPath: '/static/location.png',
    width: 50,
    height: 50
  }
];

const polyline = [
  {
    points: [
      { longitude: 116.39742, latitude: 39.909 },
      { longitude: 116.40542, latitude: 39.920 }
    ],
    color: '#FF0000DD',
    width: 5
  }
];

// 监听标记点点击事件
const onMarkerTap = (e) => {
  console.log('点击标记点', e.markerId);
};
</script>
1
2
3
4
5
6
7
8
9
10
11
12
13
14
15
16
17
18
19
20
21
22
23
24
25
26
27
28
29
30
31
32
33
34
35
36
37
38
39
40
41
42
43
2
3
4
5
6
7
8
9
10
11
12
13
14
15
16
17
18
19
20
21
22
23
24
25
26
27
28
29
30
31
32
33
34
35
36
37
38
39
40
41
42
43
编辑此页 (opens new window)
上次更新: 2025/02/01, 02:18:15